Background
A couple of months ago — near the end of my PhD — the last five brain cells not taken up by my thesis came up with a tricky question: What will you do after your PhD? Immediately, I came up with the only good answer: I don’t know. My brain cells responded: Hmm - OK. But where do you want to live?. Dammit, good question! - I replied. As the good man I am - I of course sought my girlfriend’s help for this question and after some thought we decided to move temporarily to Vancouver, BC. Question solved!, I thought at first. Oh no - question postponed…, my five brain cells replied. Since my girlfriend and I settled on an agreement (mainly forced by our parents), that we will return to Germany some time in the future, the question was not answered yet.
As a good economist, I tried to find a model suitable for helping me with my decision. And I failed to find one for Germany. There are already excellent tools for exploring regional data in Germany, such as the INKAR online atlas, the Destatis Regional Atlas, the Deutschlandatlas, or the Thünen Landatlas. But I wanted something slightly different: instead of only showing indicators one by one, I wanted to define my own priorities by weighting available data and combining those variables into a personalized index. In other words, the apps so far were great for asking “How does this region/district/county perform?” — but I wanted to know “Which region fits me best?” And honestly, that feels much more fun than staring at yet another static map while pretending to understand administrative boundaries.
Why not visit all potential regions first, get a feeling for them and then decide?, you might ask. Well, Germany has around 400 districts — and over 10,000 municipalities politely hiding inside them. That is a lot of places to visit. And my (and my girlfriend’s) FOMO kicks in heavily, if we agree upon a region, which only feels about right. No, I needed a more elaborate approach. That is why I came up with RegioIndex — a Shiny application that lets users rank German districts — including both Landkreise and Stadtkreise — based on what they actually care about. Infrastructure? Housing? Air quality? Jobs? Education? Economic indicators? Move the sliders, adjust your preferences, and watch German districts (and their counties) present themselves accordingly.
No more one-size-fits-all rankings. No more pretending that everyone wants the same “best” place to live. RegioIndex asks the important question:
What if your dream district is not everyone else’s dream district — and what if that is completely fine?
What does RegioIndex do?
The app takes regional indicators, normalizes them, applies user-defined weights, and calculates a customized index from 0 to 100. In other words: it turns your personal preferences into a ranking of German districts.
You can compare:
- all German districts (
Kreise), - only
Stadtkreise, - only
Landkreise, - and, where available, municipalities within a selected district.
There are also visualizations, interactive outputs, and enough sliders to make any data enthusiast feel (slightly too) powerful.
From the first prototype to this beta
This repository is a further development of my earlier project:
https://github.com/GStahn/ranking_german_districts
The original project focused on ranking German districts based on a customized, preference-weighted index. Users could define their own priorities, and the script then calculated and visualized the top-ranked districts.
The new project builds on that idea and turns it into a more interactive Shiny beta version:
https://github.com/GStahn/ranking_german_counties
Instead of adjusting weights directly in R code, users can now work with sliders in the browser. The app also extends the analysis by allowing users to click on a district and, where available, explore the ranked municipalities inside it.
So, in short:
The first repository asked: “Which German district fits your preferences?”
The new beta asks: “Great — and what happens if we make this interactive and zoom in further?”
That is progress. Or at least a very elaborate way to move sliders and judge places.
How to access the beta version
The current beta version (in English) is available here:
https://gstahn.shinyapps.io/Beta_counties_en/
The German beta version is available here:
https://gstahn.shinyapps.io/Beta_counties/
Since this is still a beta version, access is protected by a simple login screen. After opening the app, enter the username icke and the password hack.1
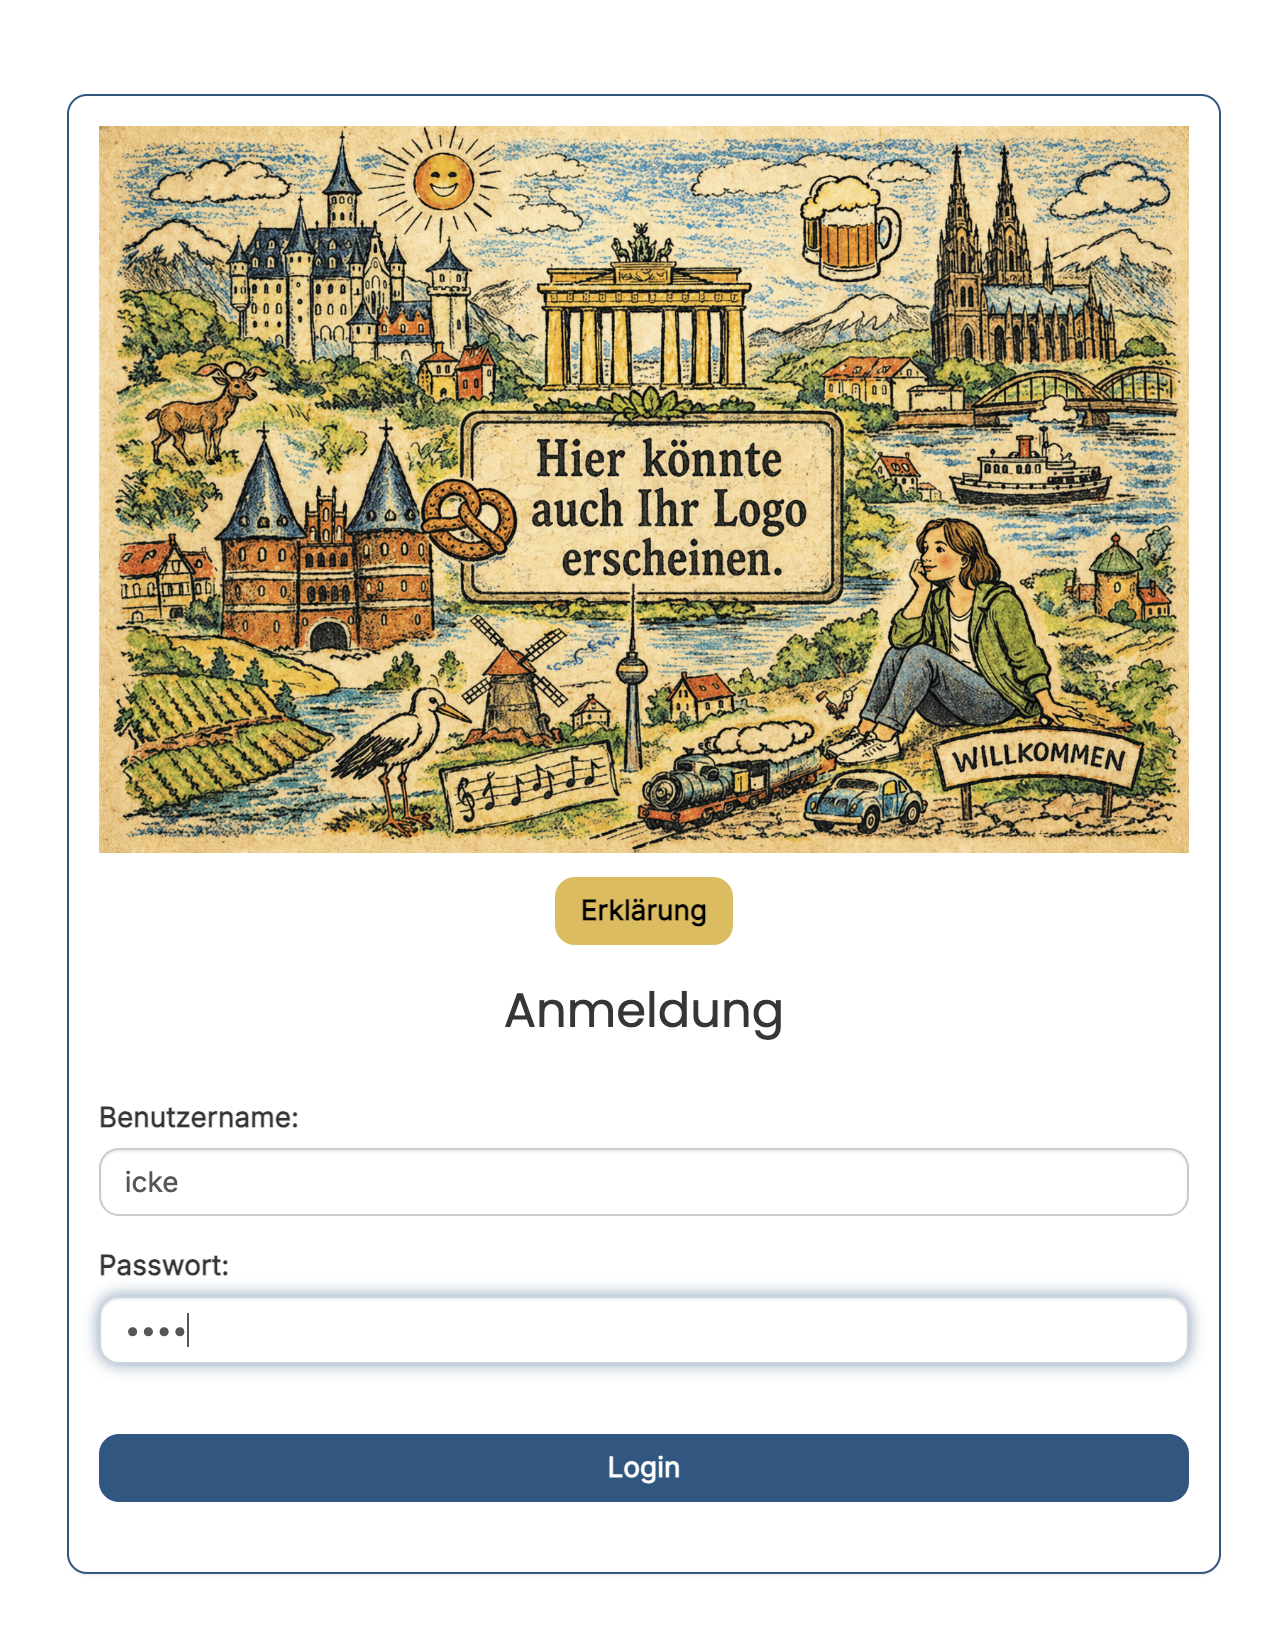
Screenshot 1: The beta login screen. Enter the username and password here to access the app.
Once logged in, you can start experimenting with the ranking immediately. Please remember: it is still a beta, so something might behave strangely.
Step 1: Choose what matters to you
The main idea behind RegioIndex is simple: different people care about different things.
That is why the app lets you adjust the importance of several regional indicators using sliders. Each slider represents one dimension of regional attractiveness. By changing the weights, you decide how much each factor will influence the final ranking.
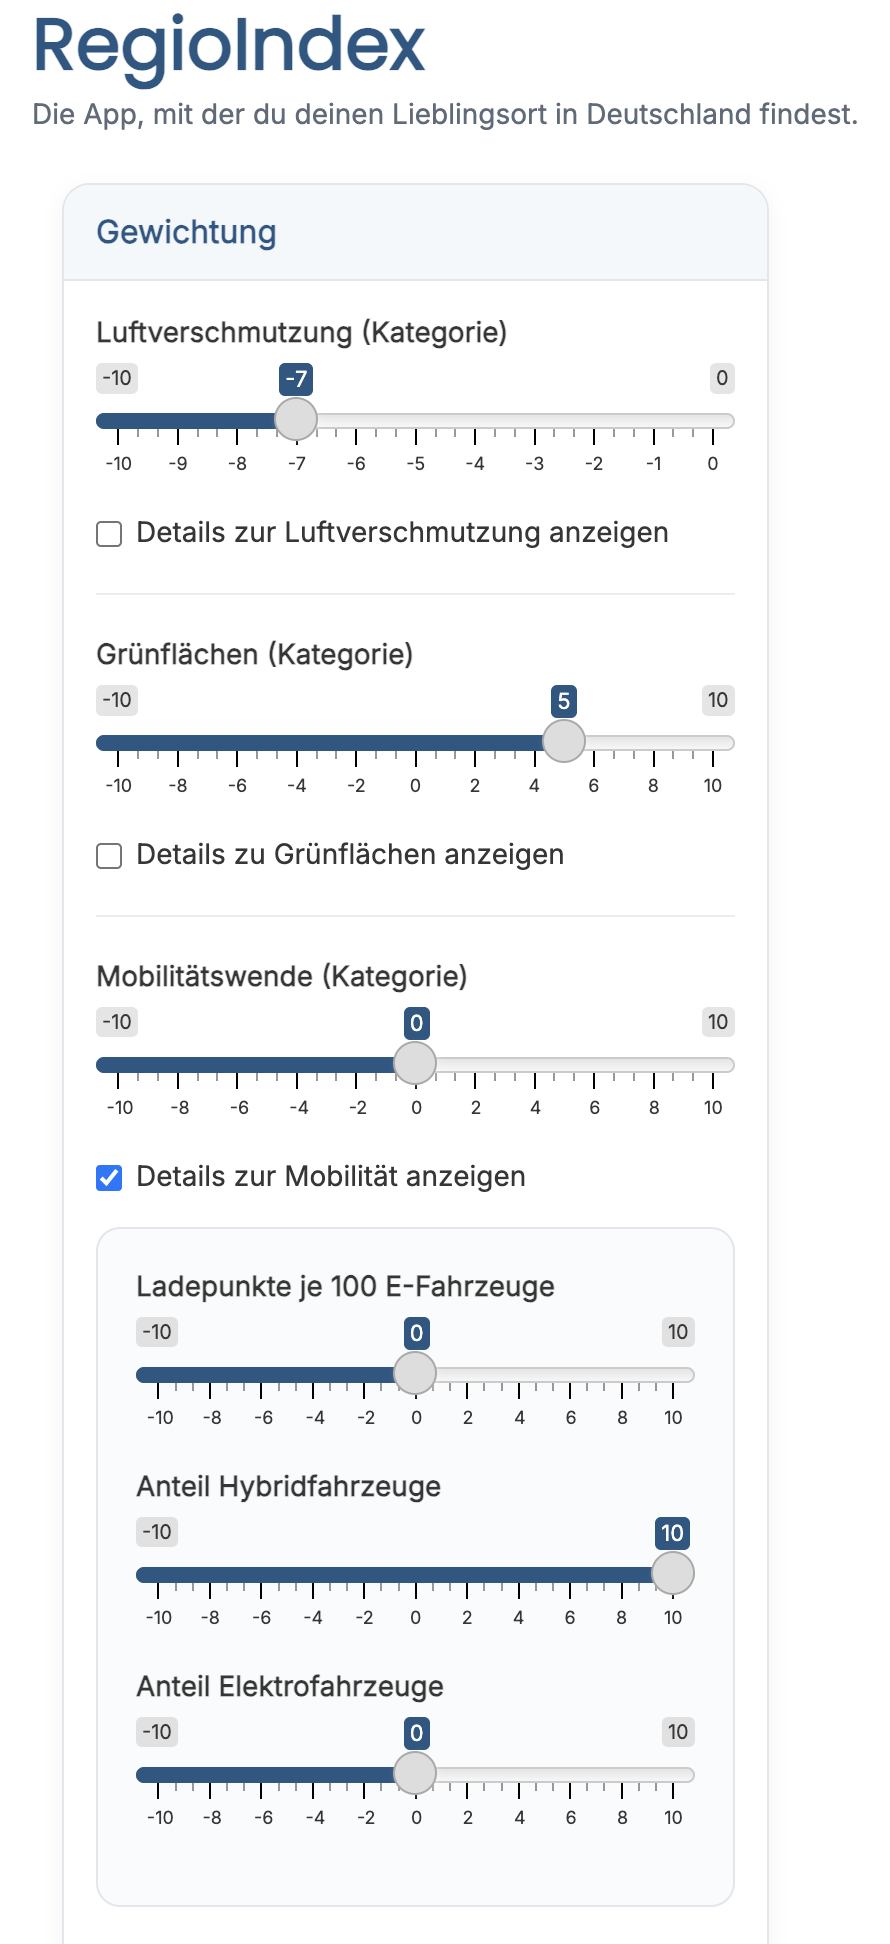
Screenshot 2: The slider interface. Use the sliders to define which indicators matter most for your personal district ranking.
The sliders can range from negative to positive values. This means users can reward indicators they consider desirable and penalize indicators they consider undesirable. For example, many electric charging stations might be a plus, while traffic accidents or pollution might be something you prefer to weight negatively (less is better).
Some categories can also be expanded. By clicking the detail checkbox, users can move beyond the broader category and adjust the underlying indicators individually. This is where RegioIndex becomes both useful and potentially time-intensive for anyone who enjoys fine-tuning things.
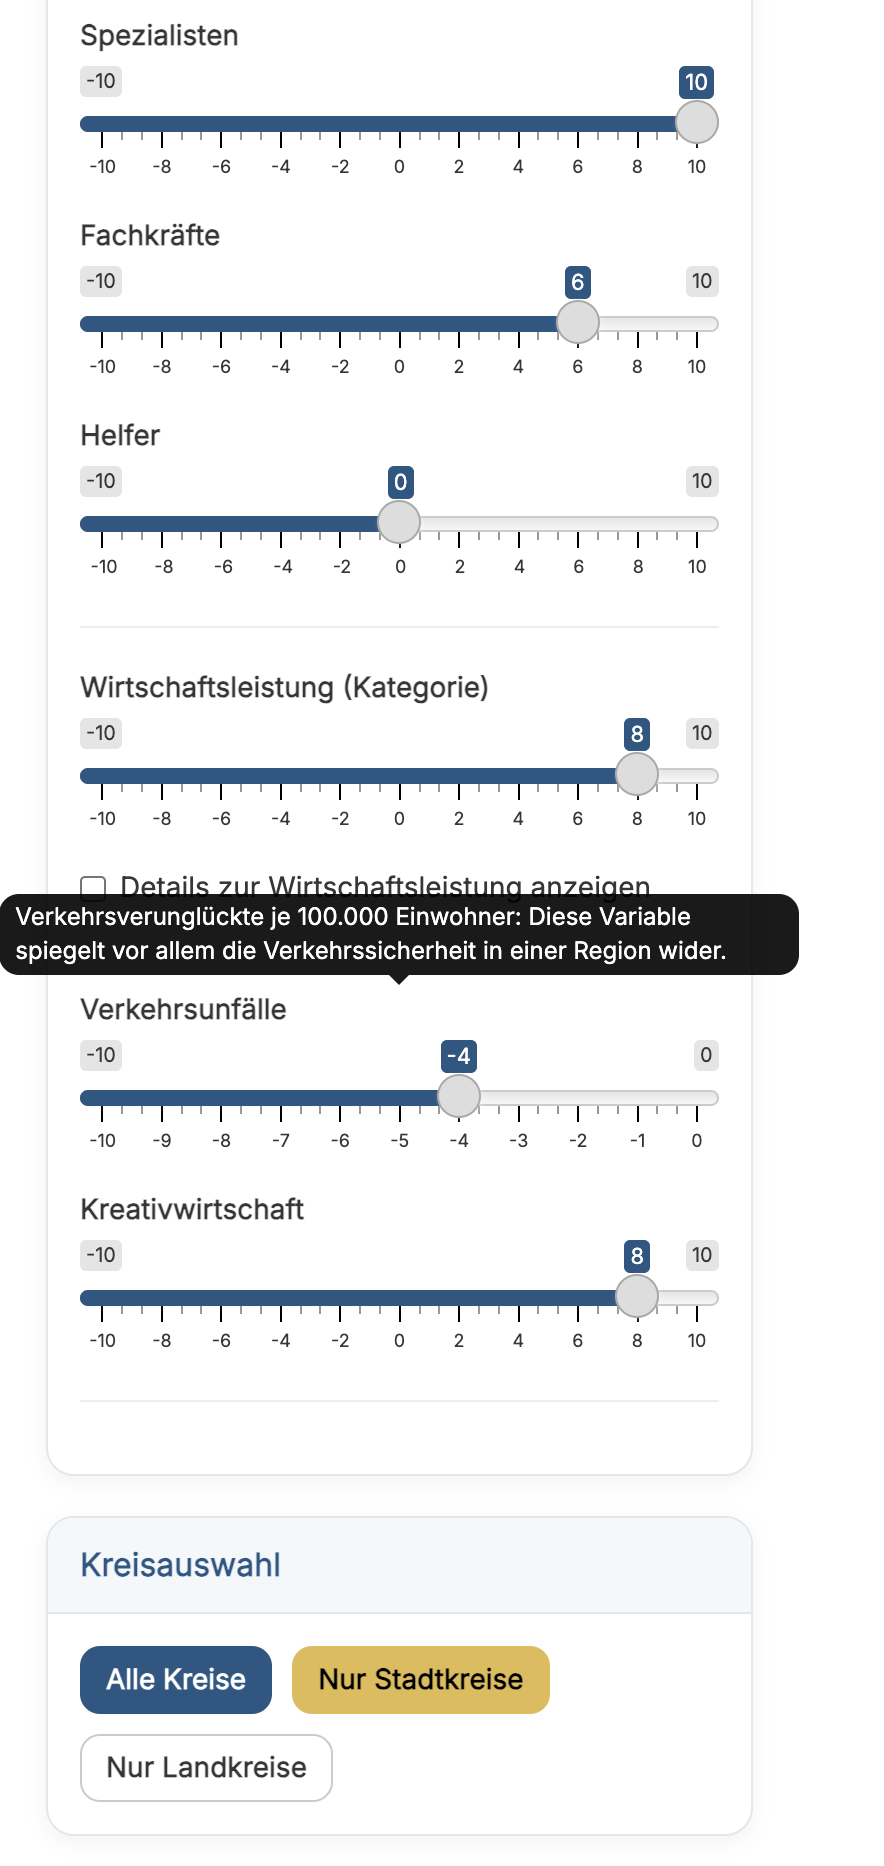
Screenshot 3: Detailed sliders allow users to adjust specific indicators. The district selection buttons can be used to compare all districts, only urban districts, or only rural districts.
At the bottom of the slider panel, users can decide which type of district should be included in the ranking:
- Alle Kreise: all districts
- Nur Stadtkreise: only urban districts
- Nur Landkreise: only rural districts
This makes it possible to compare very different types of places — or to avoid comparing apples, oranges, and Berlin-shaped administrative puzzles2.
For example, one user might care mostly about housing and infrastructure. Another might prioritize economic indicators, education, or environmental conditions. RegioIndex then recalculates the ranking based on these preferences.
This means there is not one final “best” district.
There is only the best district according to your selected weights — which is both more honest and more fun.
Step 2: See your top-ranked districts
After setting the weights, the app calculates a customized index and displays the top 20 ranked districts.
This first graphical output gives a quick overview of which Landkreise or Stadtkreise or Alle Kreise (all districts) perform best under your chosen weighting scheme.
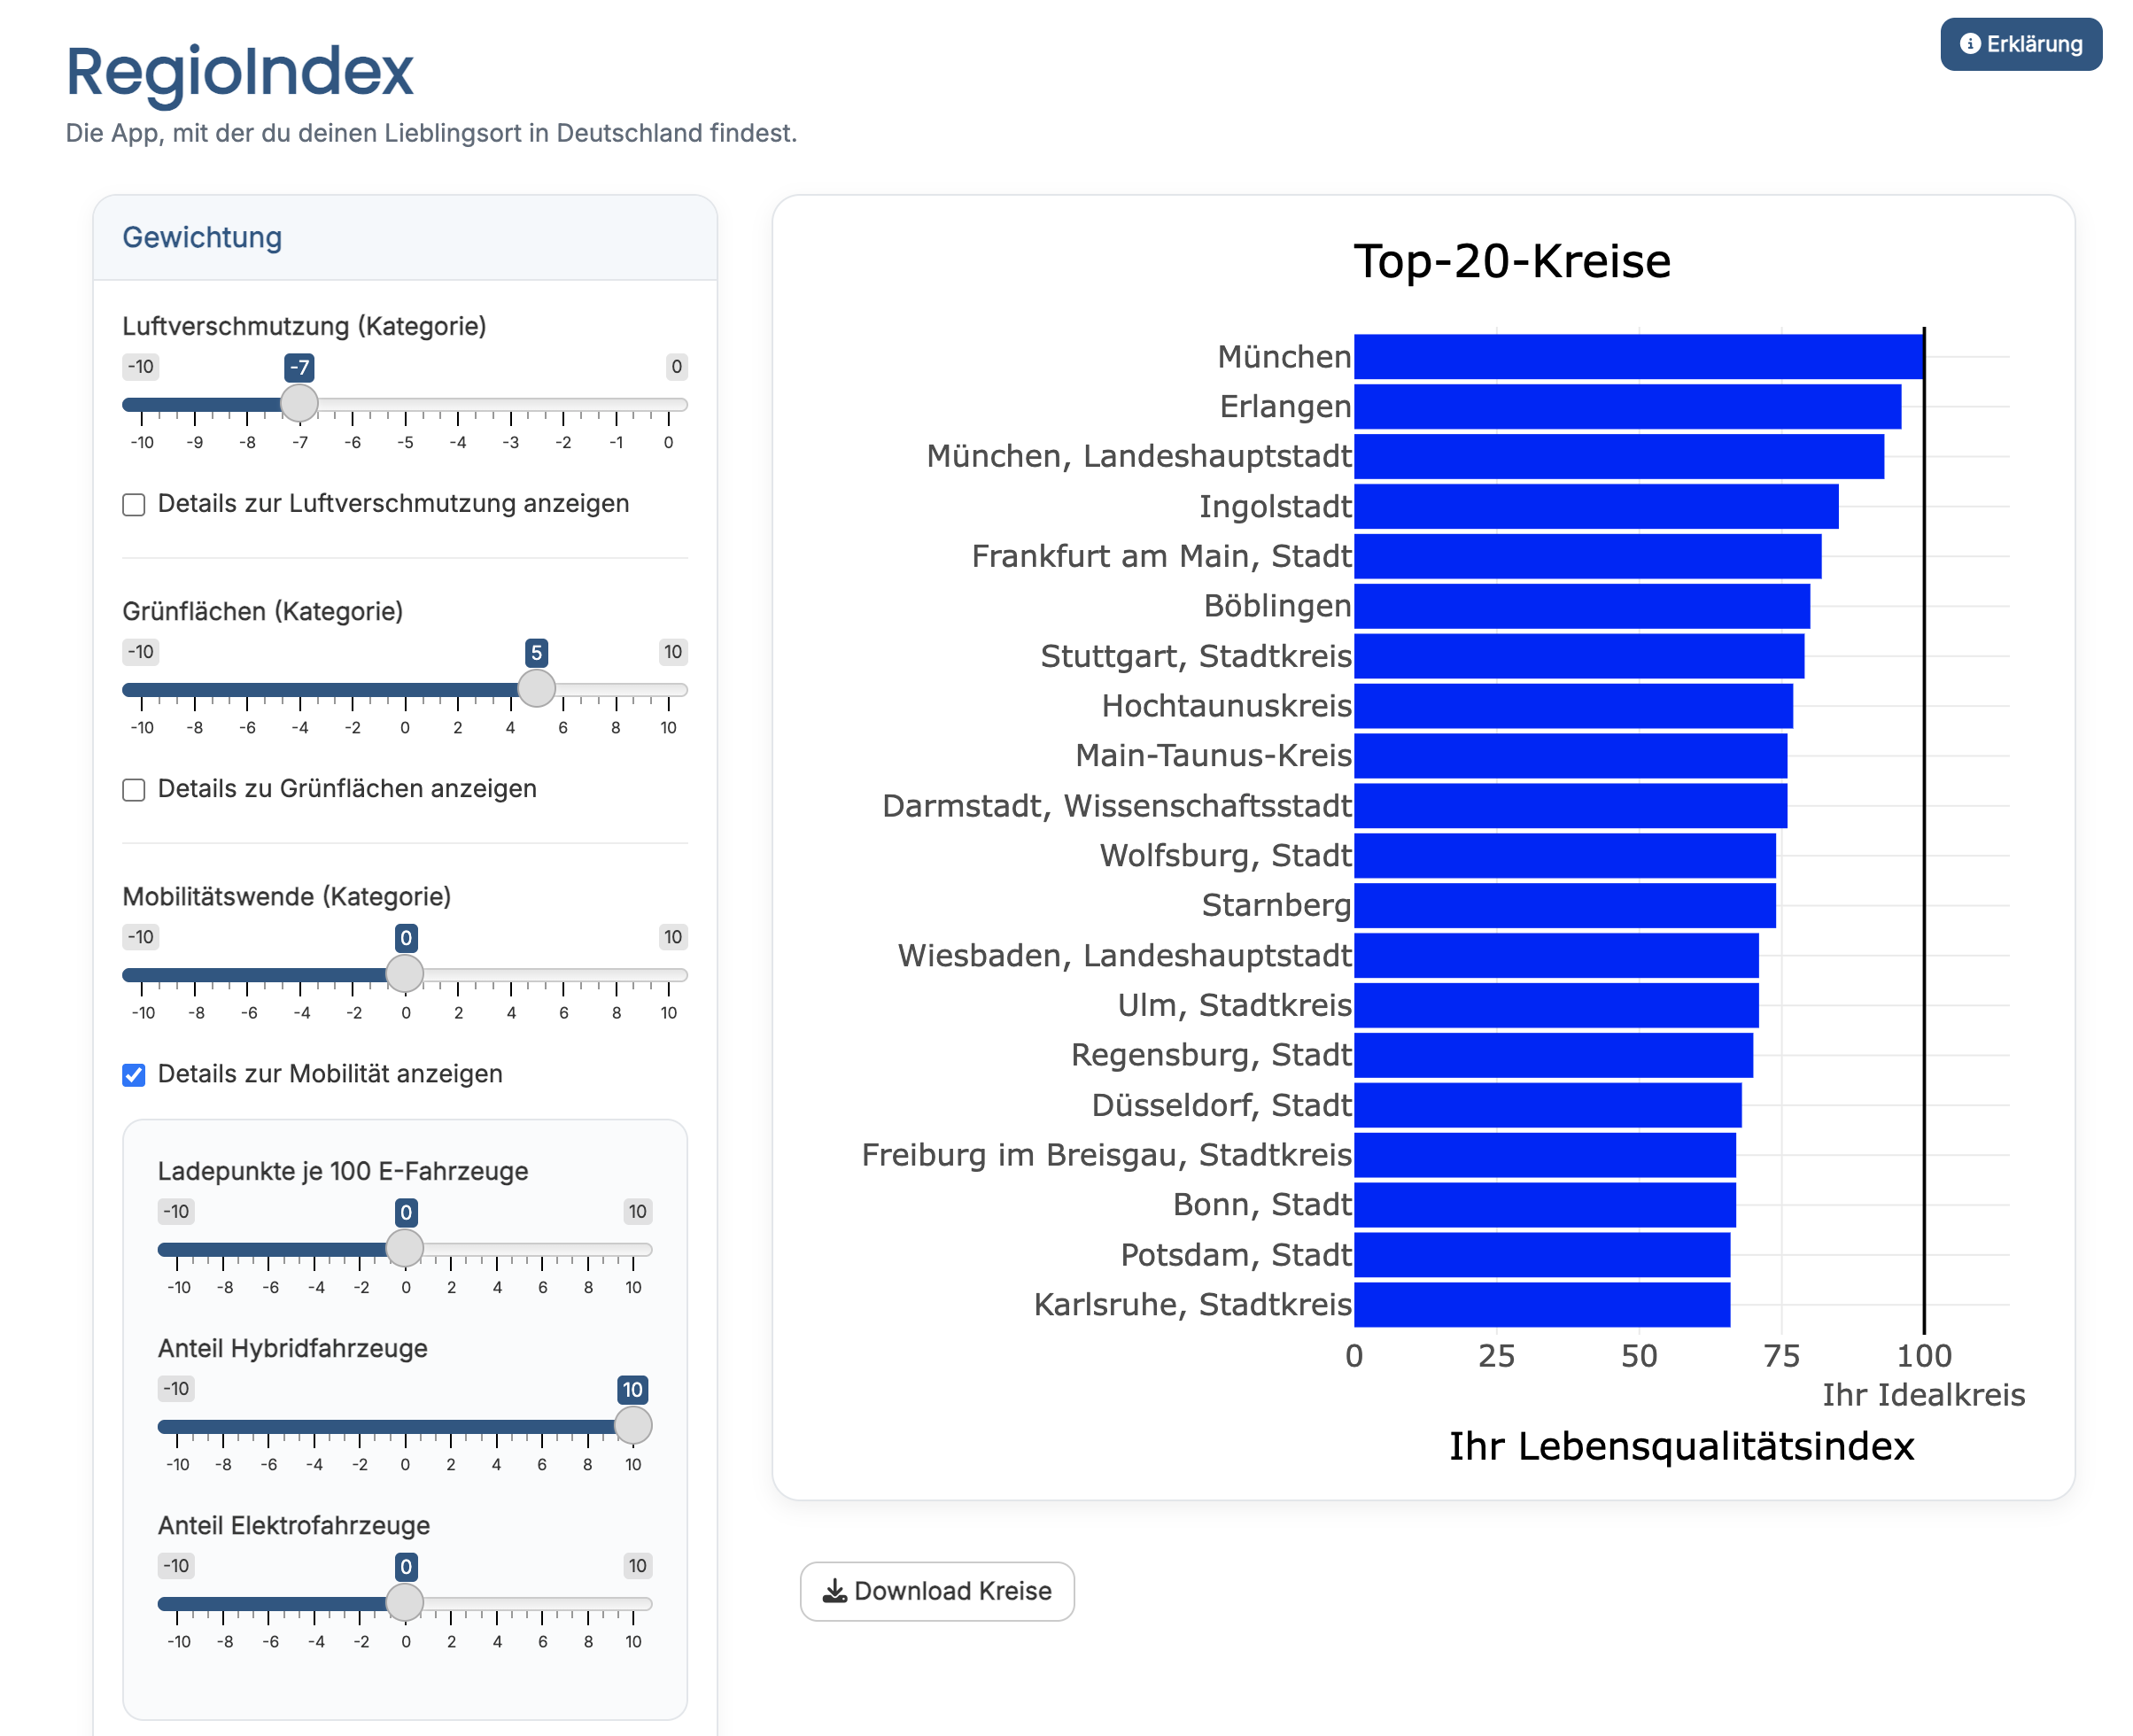
Screenshot 4: The first graphical output shows the top 20 German districts based on the selected indicator weights.
The ranking is fully preference-based. Change the sliders, and the top 20 may change as well. This is where the app becomes surprisingly addictive. Suddenly, moving one slider by five points can make a district climb the ranking immensely.
The vertical line marks the ideal value of the hypothetical perfect index. The closer a district gets to this line, the better it matches the selected preferences. In the example above, Munich performs strongly under the selected weighting scheme — which will either confirm your expectations or make you immediately suspicious of your own choices.
Step 3: Click on a district for more detail
The app does not stop at the district level. If you click on a ranked district, RegioIndex can provide a second output showing the municipalities within that district — if the selected district contains municipalities.
These municipalities are ranked using the same weighting logic as the district ranking.
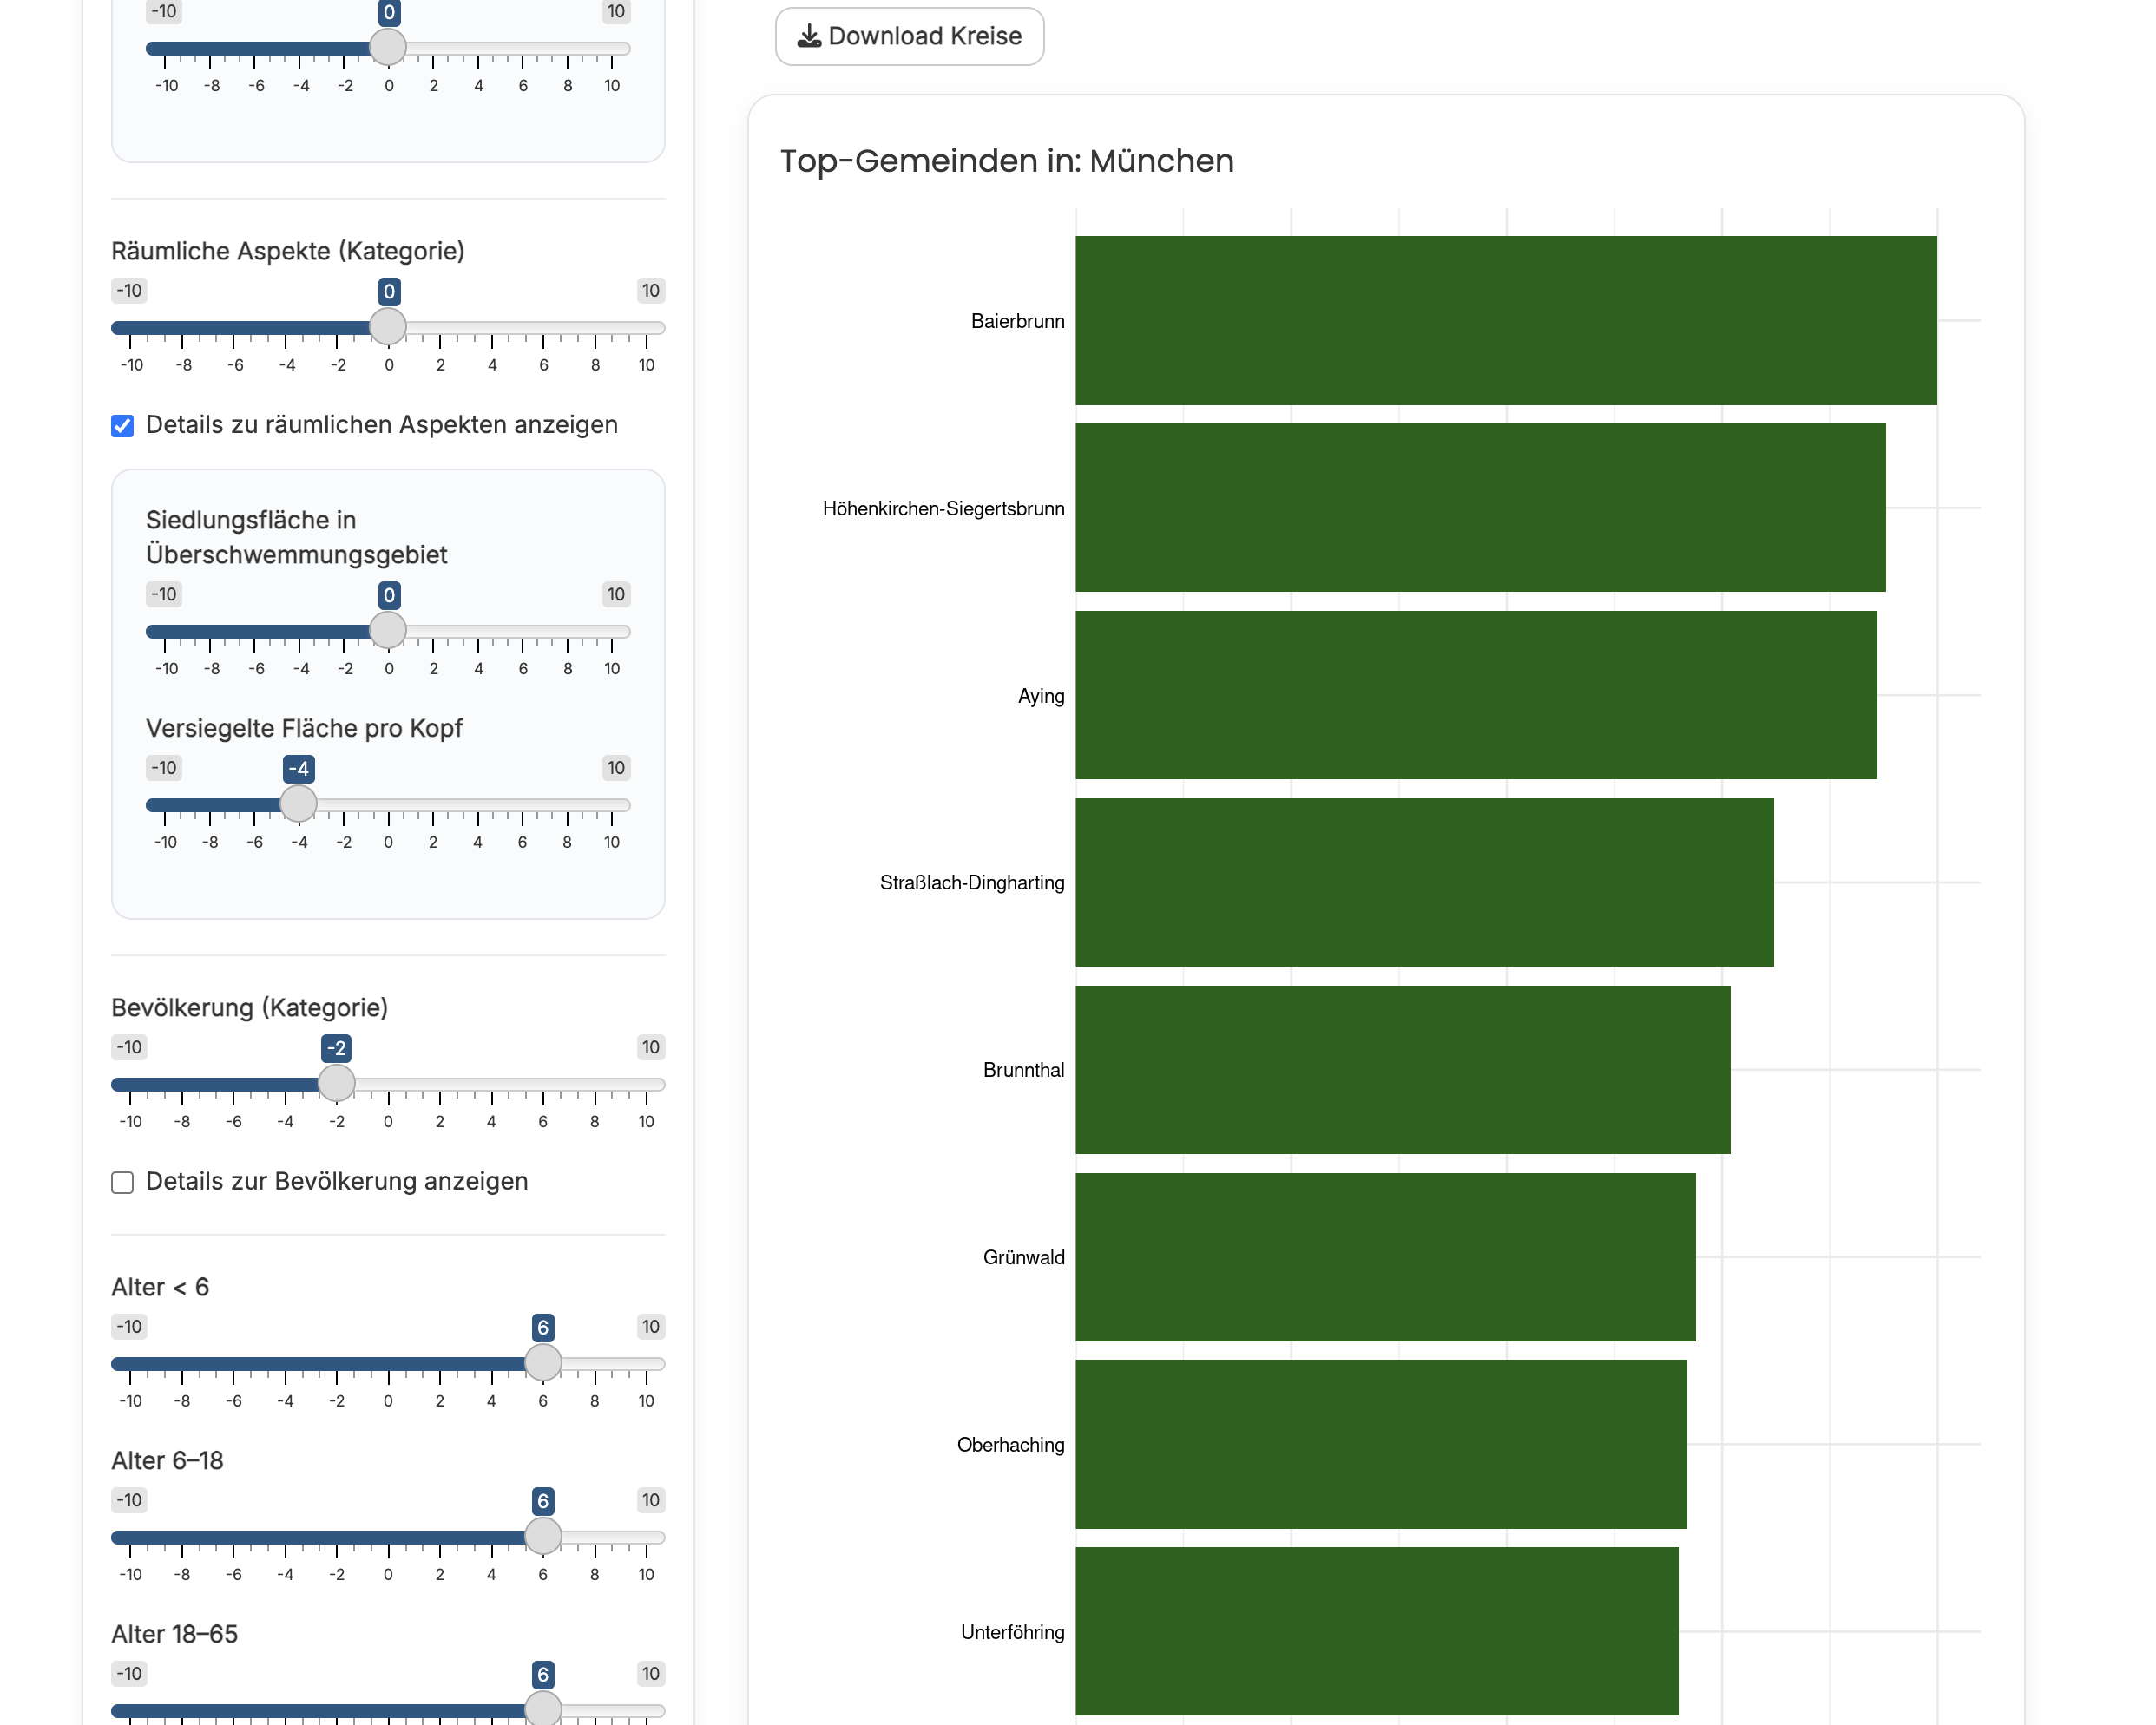
Screenshot 5: After clicking on a district, the second output shows ranked municipalities within that district, based on the same selected weights.
This allows users to move from a broader regional comparison to a more detailed local perspective. In other words, you can first ask:
Which district looks best for my preferences?
And then ask:
Nice. But where inside that district should I actually look?
For Stadtkreise or districts without municipality-level information in the app, this second output may not appear or may contain no additional municipality ranking. That is not a bug — that is just German administrative geography being German administrative geography.
Why build this?
As stated in the beginning: “best region” is a personal concept.
For one person, good public infrastructure might be everything. For another, housing costs or air quality might matter more. Someone else might want strong economic indicators, good education, or simply a place where the data says: “Yes, this district might actually tolerate your lifestyle choices.”
RegioIndex is my attempt to make regional comparison more interactive, transparent, and preference-based3.
Try it yourself
The beta version is available here:
https://gstahn.shinyapps.io/Beta_counties/
The project repository is here:
https://github.com/GStahn/ranking_german_counties
The earlier district-ranking repository is here:
https://github.com/GStahn/ranking_german_districts
Again: the app is still in beta, so things may change, improve, or occasionally behave strangely.
Final thought
RegioIndex will not tell you where you must live.
But it might help you discover which German district — and maybe even which municipality inside it — best matches your preferences.
Or at the very least, it gives you a very data-driven excuse for arguing about regional attractiveness at dinner.
I added this login page, since I wanted to sell this app to any company interested in buying it. The first picture on the login page says it all. But I did not start to contact companies. It would be too much work, I imagined, and flexing with the project online is enough payback for me. ↩︎
The last phrase was suggested by ChatGPT. I don’t know how it came up with this nonsense. But I kept it in as a reminder that LLMs often suck. ↩︎
As an economist I love that word: Preferences. ↩︎